In a tool that hunts for faults, the review screen carries the product
LineGuard AI: computer vision for power line inspection, designed in three and a half days
· 4 min read · Nikita Miezhenski
Russia has more than 2.5 million km of power lines, and according to the Rosstat figures we used in the pitch, maintaining them costs about a trillion rubles a year. Most energy companies still inspect lines by eye. Crews walk the route or fly it in a helicopter, and where drones are used, people look through the photos by hand. Small defects get missed, and every inspection takes a lot of people and time.
LineGuard AI takes drone photos of power lines, finds damaged parts with computer vision and pins them to a route map for an engineer to review. The case came from the Center of Industrial Digital Technologies, which also acted as its client. We built it in three and a half days in a regional round of a Russian national hackathon in 2025 and took first place. I was the designer on a team of three and did all of the design, from the first user flow to the UI kit, the screens, the identity and the pitch deck.
The model will be wrong sometimes
We put four problems in the pitch: manual checks miss small defects; photos differ in light, angle and distance, and parts hide behind others; rare kinds of damage have few examples; and a missed defect or a false alarm can each lead to a failure. The team answered them with augmentation, multi-scale detection, oversampling, a class-weighted loss and confidence calibration. For the interface it meant one thing: the model will be wrong sometimes, so the engineer has to see how sure it is and be able to correct it.
The flow
An engineer drops the drone photos into the upload area, checks them as thumbnails, removes the wrong ones and starts the analysis. While the model works, the screen counts processed files, for example “Processed 6 / 388”.
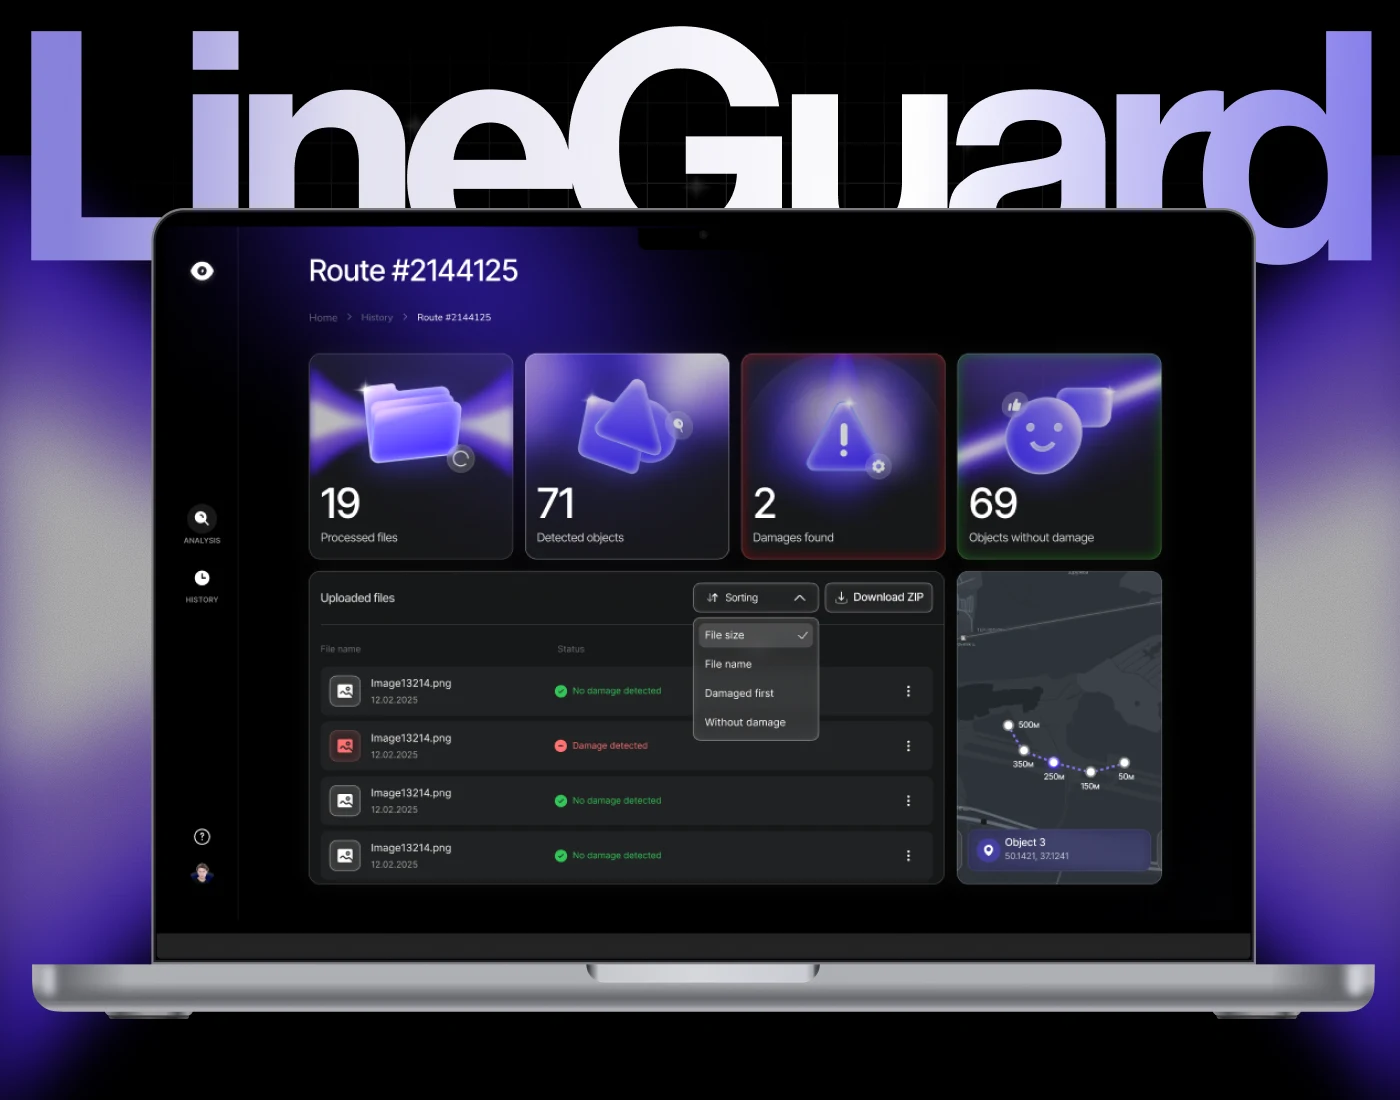
Each flight is a route with its own page. Four cards at the top give the totals: processed files, detected objects, damages found and objects without damage. The damage card has a red frame and the clean one a green frame, so the number that needs action stands out. Below, the file list shows the status of each photo, sorts damaged files to the top and downloads the whole set as a ZIP. The map places every object using the drone’s image metadata, with its coordinates and the distance along the line.
The review screen
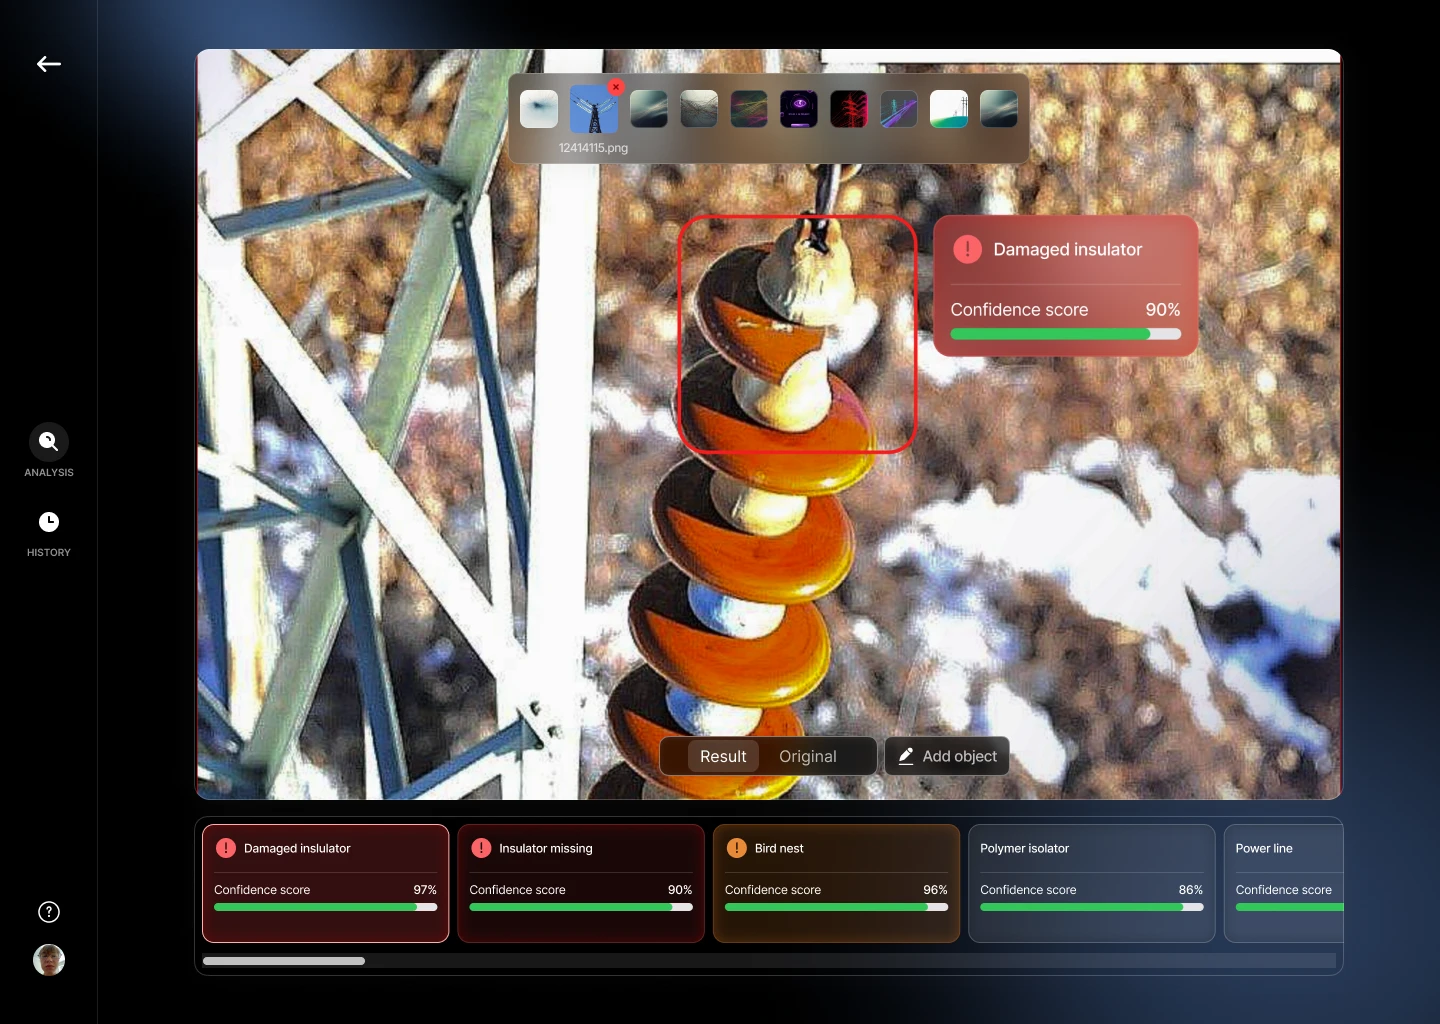
Opening a photo shows the model’s result on top of it: a box around the part and a label such as “Damaged insulator” with its confidence score. Under the photo is every object the model found in the frame, each with its own score. Damage is red, a bird’s nest is orange, and healthy parts stay grey. The engineer can switch between the result and the original photo and outline a missed object by hand.
The totals on the route page only help after the engineer has decided whether to trust a result.
After the hackathon I also laid out the route page for a phone: the cards scroll sideways, with the map and the file list stacked below. The identity is a logo of an eye with a lightning bolt, set in Inter Tight on a dark interface with electric indigo as the accent.
The stack, for the record: YOLO v8 trained in Google Colab on the dataset that came with the case, React with TypeScript, FastAPI, RabbitMQ, PostgreSQL and Docker. The back end and the front end worked by the end of the round.
What I learned applies past power lines. In any tool that hunts for faults, a confidence score on every detection and a way to add what the model missed are what let a person decide whether to trust a result. Design that screen first, and the dashboard after.